
Can Toronto Become a Truly Year-Round Cycling City?
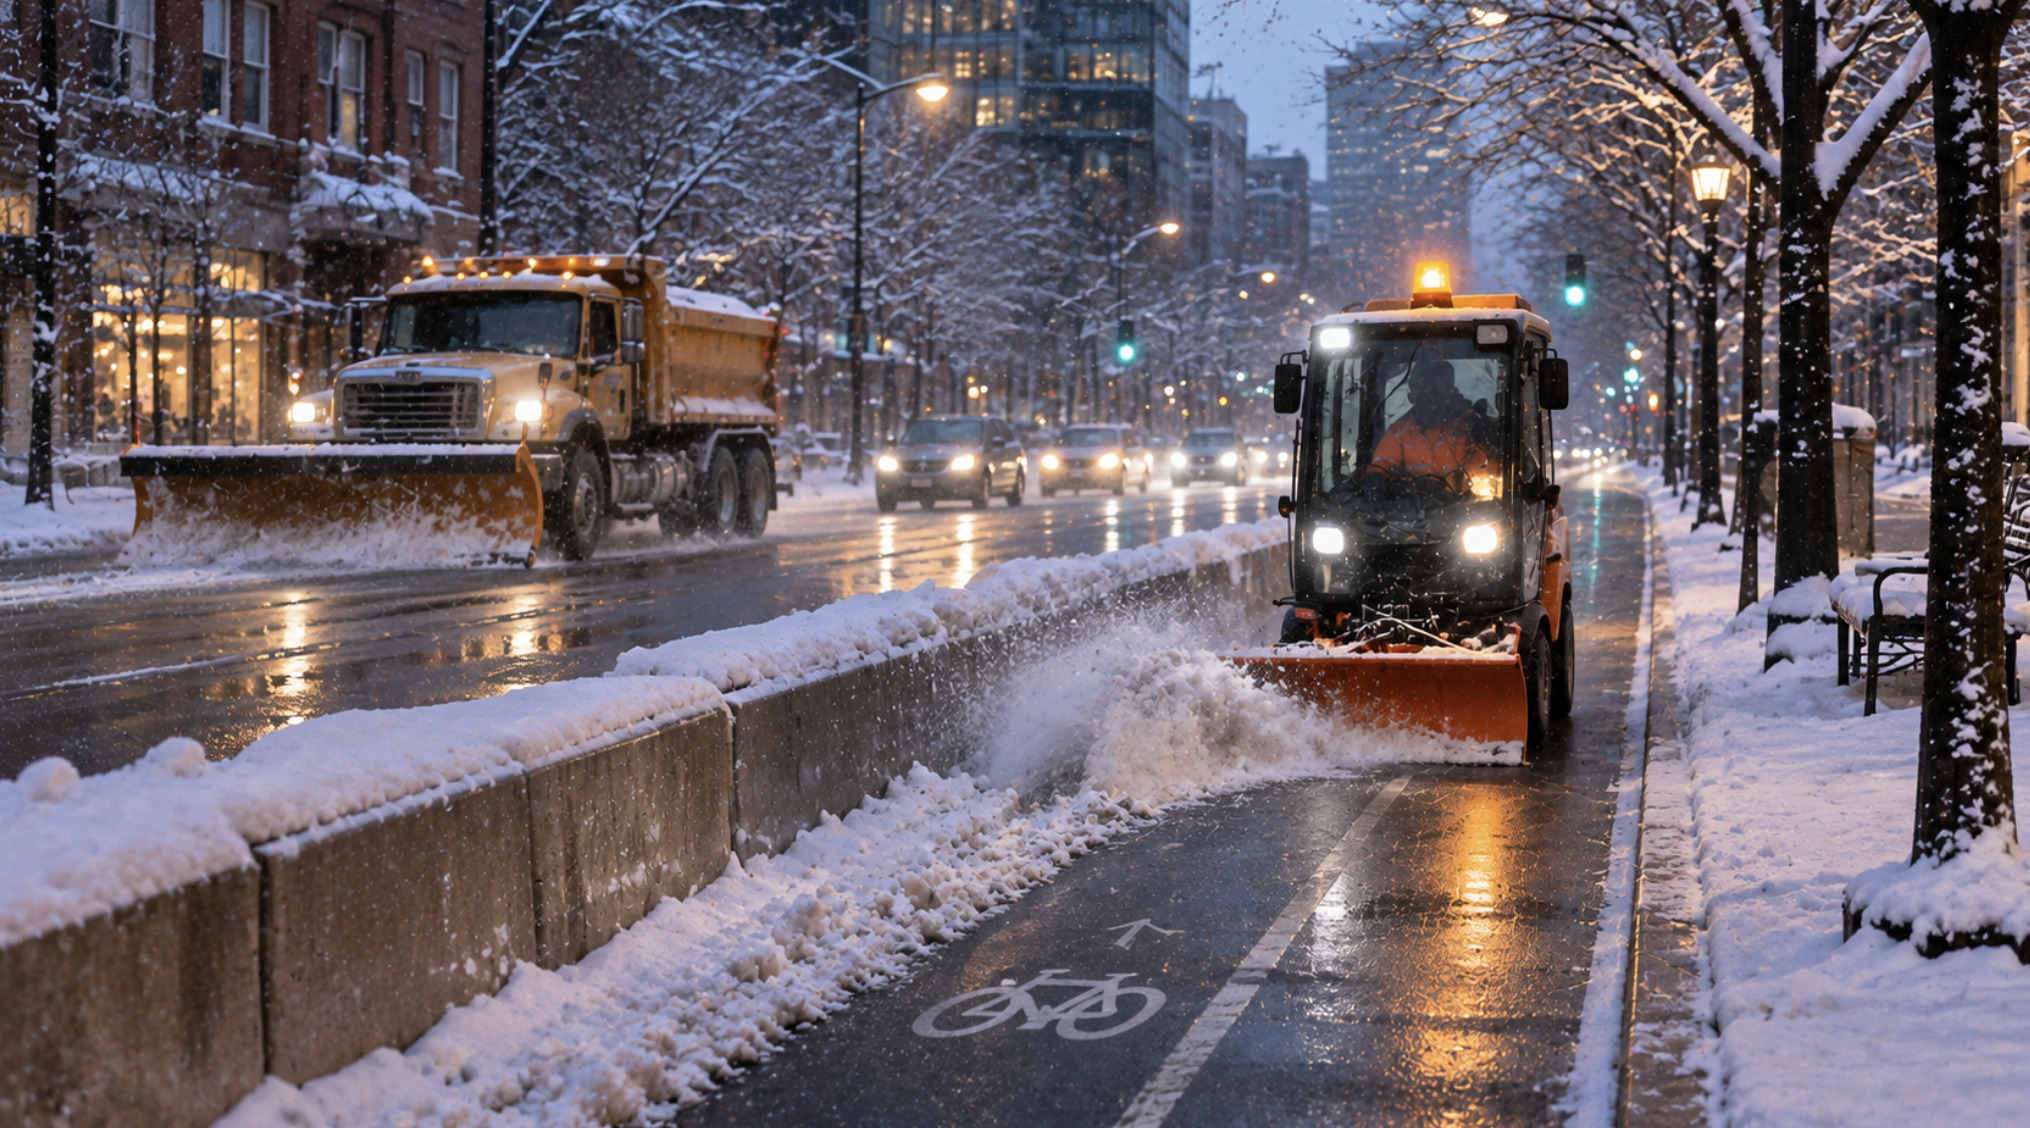
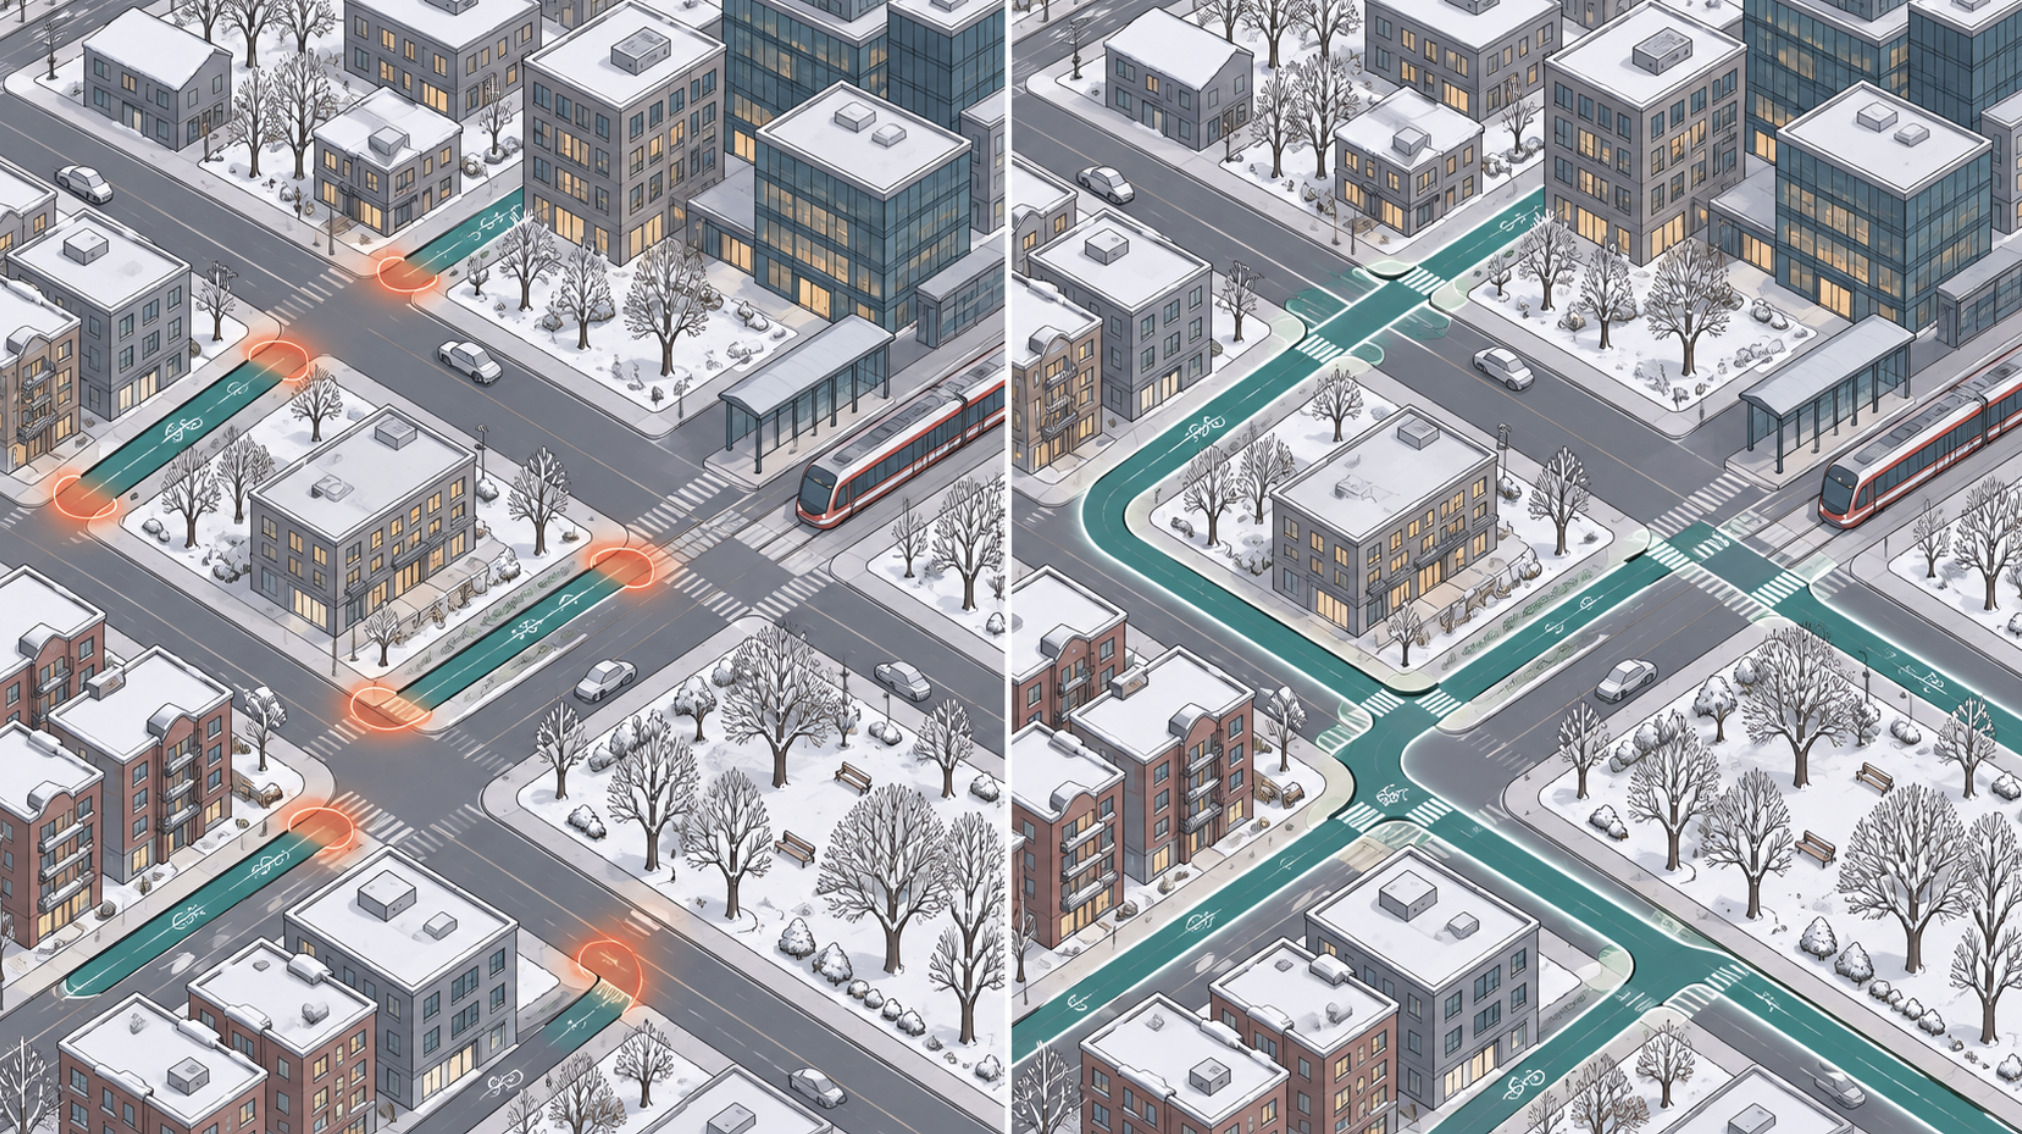
Twelve intersections from usable
The commute described here is a composite, written to illustrate a pattern. It is not an account of a witnessed journey.
It snowed overnight — eight or nine centimetres, a routine Toronto snowfall — and by seven in the morning it has stopped. A nurse who lives near Dufferin Grove wheels her bike out with studded tires already fitted, heading for a hospital shift downtown.
The first stretch is fine. The residential side street has been plowed once, leaving a packed but rideable surface. On the main east-west cycle track the city's small sidewalk-sized plow has already been through; the concrete curb is visible, the pavement mostly bare and salted. For twenty minutes the commute is unremarkable.
Then the route turns south. The painted bike lane on the connecting street has become the place where the road plow left its windrow: a ridge of grey slush and chunks of ice where the bike lane used to be. A parked delivery van sits on top of what remains. Two blocks later, at a busy intersection, the corner where cyclists queue is a slush pond, and the curb cut that leads to the next separated lane is buried under a snowbank pushed there by a sidewalk machine. She can ride in the general traffic lane, with buses passing close, or walk the bike through slush. She does both.
No single segment was impassable. The weather was not extreme. The commute failed because a reliable route is only as good as its worst link, and the worst link in this case was perhaps a dozen intersections and two short connectors.
That is the central question for Toronto as it heads into another winter: is year-round cycling here primarily a weather problem, or a network-management problem? The answer matters, because the two lead to very different policies — and because, in late 2026, the city is trying to answer it while the province removes some of its most important bike lanes.
Part I — A network of pieces
Two cities in one
Toronto's cycling geography follows its urban form. The pre-war city — roughly the old City of Toronto and East York — has a tight street grid, short blocks, dense mixed-use main streets and a large share of jobs within a few kilometres of large residential populations. Many trips there are short enough to cycle comfortably, and the TTC subway, streetcar and bus network is dense enough that cycling and transit complement each other.
The post-war inner suburbs of Etobicoke, North York and Scarborough are different. Arterials are wide and fast, blocks are long, land uses are separated, and trip distances between home, work, school and shopping tend to be longer. Transit connections can involve long waits and transfers. A bicycle can be an efficient way to reach a subway or GO station, but the arterial roads that make those connections are among the least comfortable in the city to ride.
The City's own figures show how unevenly safe infrastructure is distributed. Of the 14.1 kilometres of new bikeways installed in 2025, 59 per cent was in Toronto and East York. A 2026 budget briefing note reported that the share of residents and jobs within 250 metres of a dedicated bikeway had grown from 44 per cent in 2020 to 50 per cent in 2025. That is real progress — and it means half the city's people and employment are still more than a short block from one.
What exists, and what has been promised
Toronto reports its network in centreline kilometres — the length of the street or trail segment, regardless of direction. At the end of 2025, according to the City's Cycling Year in Review, the network stood at about 745 kilometres: roughly 399 km of multi-use trails, 110 km of cycle tracks, 144 km of painted bicycle lanes (including buffered and contraflow lanes) and 92 km of shared-lane markings. The City's winter operations material refers to a larger figure, 956 kilometres of bike lanes and major trails, because maintenance counts include trail and lane segments measured differently. Readers should not compare the two numbers directly.
Plans and delivery have long diverged. The 2016 ten-year plan envisaged 335 km of on-street bikeways; analysis by Spacing found that about 144 km were installed by the end of 2025. The current 2025–2027 Near-Term Implementation Program, adopted by City Council in June 2024, targets 100 km of new and major upgrade projects plus 40 km of renewals. In 2025 the City delivered 14.1 km of new bikeways and about 9 km of upgrades, with another 16 km under construction at year's end. The 2026 capital budget of $35 million plans for about 24.5 km of new bikeways.
Routes versus networks
The distinction that matters for winter is between route availability and network connectivity. A route exists when there is a bike lane on a given street. A network exists when someone can get from where they are to where they need to go without passing through a segment they would not ride. Most people's decision to cycle is governed by the worst segment of their trip, not the best.
That is why isolated bike lanes underperform. A cycle track that ends at a six-lane arterial, or a painted lane that disappears at a highway interchange, delivers less than its length suggests. And it is why the province's actions matter so much. Bill 212, the Reducing Gridlock, Saving You Time Act, 2024, now requires designated municipalities to obtain provincial approval before installing bike lanes that remove a vehicle lane. A City briefing note in January 2026 reported that roughly 30 per cent of projects in the 2025–2027 plan had to be redesigned, paused or deferred as a result. The same law directs the removal of protected lanes on Bloor Street, Yonge Street and University Avenue — the spine of the downtown network. Part V returns to what that means.
Part II — What winter actually changes
Toronto receives about 130 centimetres of snow in an average year, according to the City. That figure hides more than it reveals. Snow tends to arrive in a modest number of events, and much of the winter is cold and dry, or near freezing and wet. The conditions that matter most for cycling are not the same as the ones that dominate weather reports.
Fresh snow is the most visible problem but often the most temporary. A few centimetres on a cleared surface is rideable with care; deep, unplowed snow is not. Ice is more dangerous. It forms when meltwater refreezes overnight, when slush is compacted into ruts, or when freezing rain glazes a surface. Toronto's position on Lake Ontario produces frequent freeze-thaw cycles, which means a lane that was bare at noon can be glazed by the morning commute. Slush and windrows — the ridges left by road plows — narrow or block lanes even after a modest snowfall.
Road salt helps keep pavement bare, but it corrodes chains, cables and bearings, and the brine and grit it produces make surfaces greasy at the margins. Daylight shrinks to about nine hours around the winter solstice, so many commutes happen in the dark, and visibility is reduced further by spray, low sun and fogged windows on the vehicles sharing the road. Wind off the lake and along wide arterials adds a chill and an effort that are easy to underestimate.
Equipment can mitigate some of this. Studded tires grip ice; fenders, lights and appropriate clothing handle the rest of the discomfort. But equipment cannot fix a buried lane or a blocked curb cut.
It helps to separate discomfort from risk. Cold, wet and dark are uncomfortable, and they will reasonably deter many people on many days. Ice, poor visibility, narrowed lanes that push cyclists into traffic and reduced driver sight lines are risks. Good infrastructure and maintenance address mainly the second category; they can make a cold commute safe without making it pleasant.
The City's counter data shows how much riding continues regardless. Based on its permanent counting stations, the City reports that winter volumes (December to February) average about 30 per cent of summer volumes (June to August), and reached 43 per cent at the counter on Yonge Street north of Bloor, which sits on a protected lane. Bike Share Toronto, which operates year-round, reported that its January-to-March ridership grew by 137 per cent between 2022 and 2025, during a period of major system expansion. The counter network is small — 23 locations at the end of 2025, mostly on dedicated bikeways — so it says more about who rides on good infrastructure than about the city as a whole.
None of this means everyone should cycle in every condition. A freezing-rain morning is hazardous for anyone on two wheels, and for many people walking. A realistic goal is not universal winter cycling; it is that on the ordinary winter days that make up most of the season, the network is usable by people who choose to ride.
Part III — The politics and engineering of snow clearance
What the standards say
Toronto's winter maintenance standards are explicit, and on paper they are ambitious for cycling. Under the levels of service Council has adopted, separated cycle tracks and multi-use paths are to be plowed and salted when snow reaches 2 centimetres, with operations completed within 8 hours, and the target outcome is "bare pavement" — defined in a 2024 staff report as at least 90 per cent of the surface free of snow, slush and ice. A 2024 revision brought painted on-road bike lanes into line with the same 8-hour maximum operating time, with a "safe and passable" outcome. Painted lanes are generally cleared alongside the adjacent road.
For comparison, the City begins plowing major roads and transit routes at 5 cm and residential streets at 8 cm. In other words, the written standard for separated cycling infrastructure is to start earlier than for most roads.
These are municipal standards layered on top of Ontario's Minimum Maintenance Standards for Municipal Highways, which since 2018 have included specific provisions for bicycle lanes. Those provincial standards also allow a municipality to declare a Significant Weather Event, during which the normal timelines are suspended and the obligation becomes monitoring and deploying resources as conditions allow.
What actually happens
A written standard is a promise about ordinary snowfalls. The test of a network is what happens around the edges of that promise.
Toronto's winter of 2025–26 provided a hard test. January 2026 was the city's snowiest month since records began in 1937, according to Environment Canada, and a single storm on January 25 dropped roughly 60 cm. The City activated its Major Snow Event Response Plan and declared a Significant Weather Event. A week later, The Canadian Press reported cyclists and delivery workers describing major lanes on Bloor Street, University Avenue and College Street as still choked with snow; the City said it could not give a specific timeline for clearing all 956 km of bikeways, and that lanes cleared once were often re-covered by road plowing and blowing snow. CP24 reported snow-covered bike lanes still visible across the city in mid-February.
It would be unfair to judge any system by a record storm. But earlier in the same month, after a smaller event on January 14–15, writers in Spacing documented initially cleared lanes deteriorating into packed snow and ice within days on several streets. Problems that appear after modest snowfalls are a better indicator of design and operations than those that appear after historic ones.
Where clearance breaks down
The recurring failure points are operational rather than meteorological.
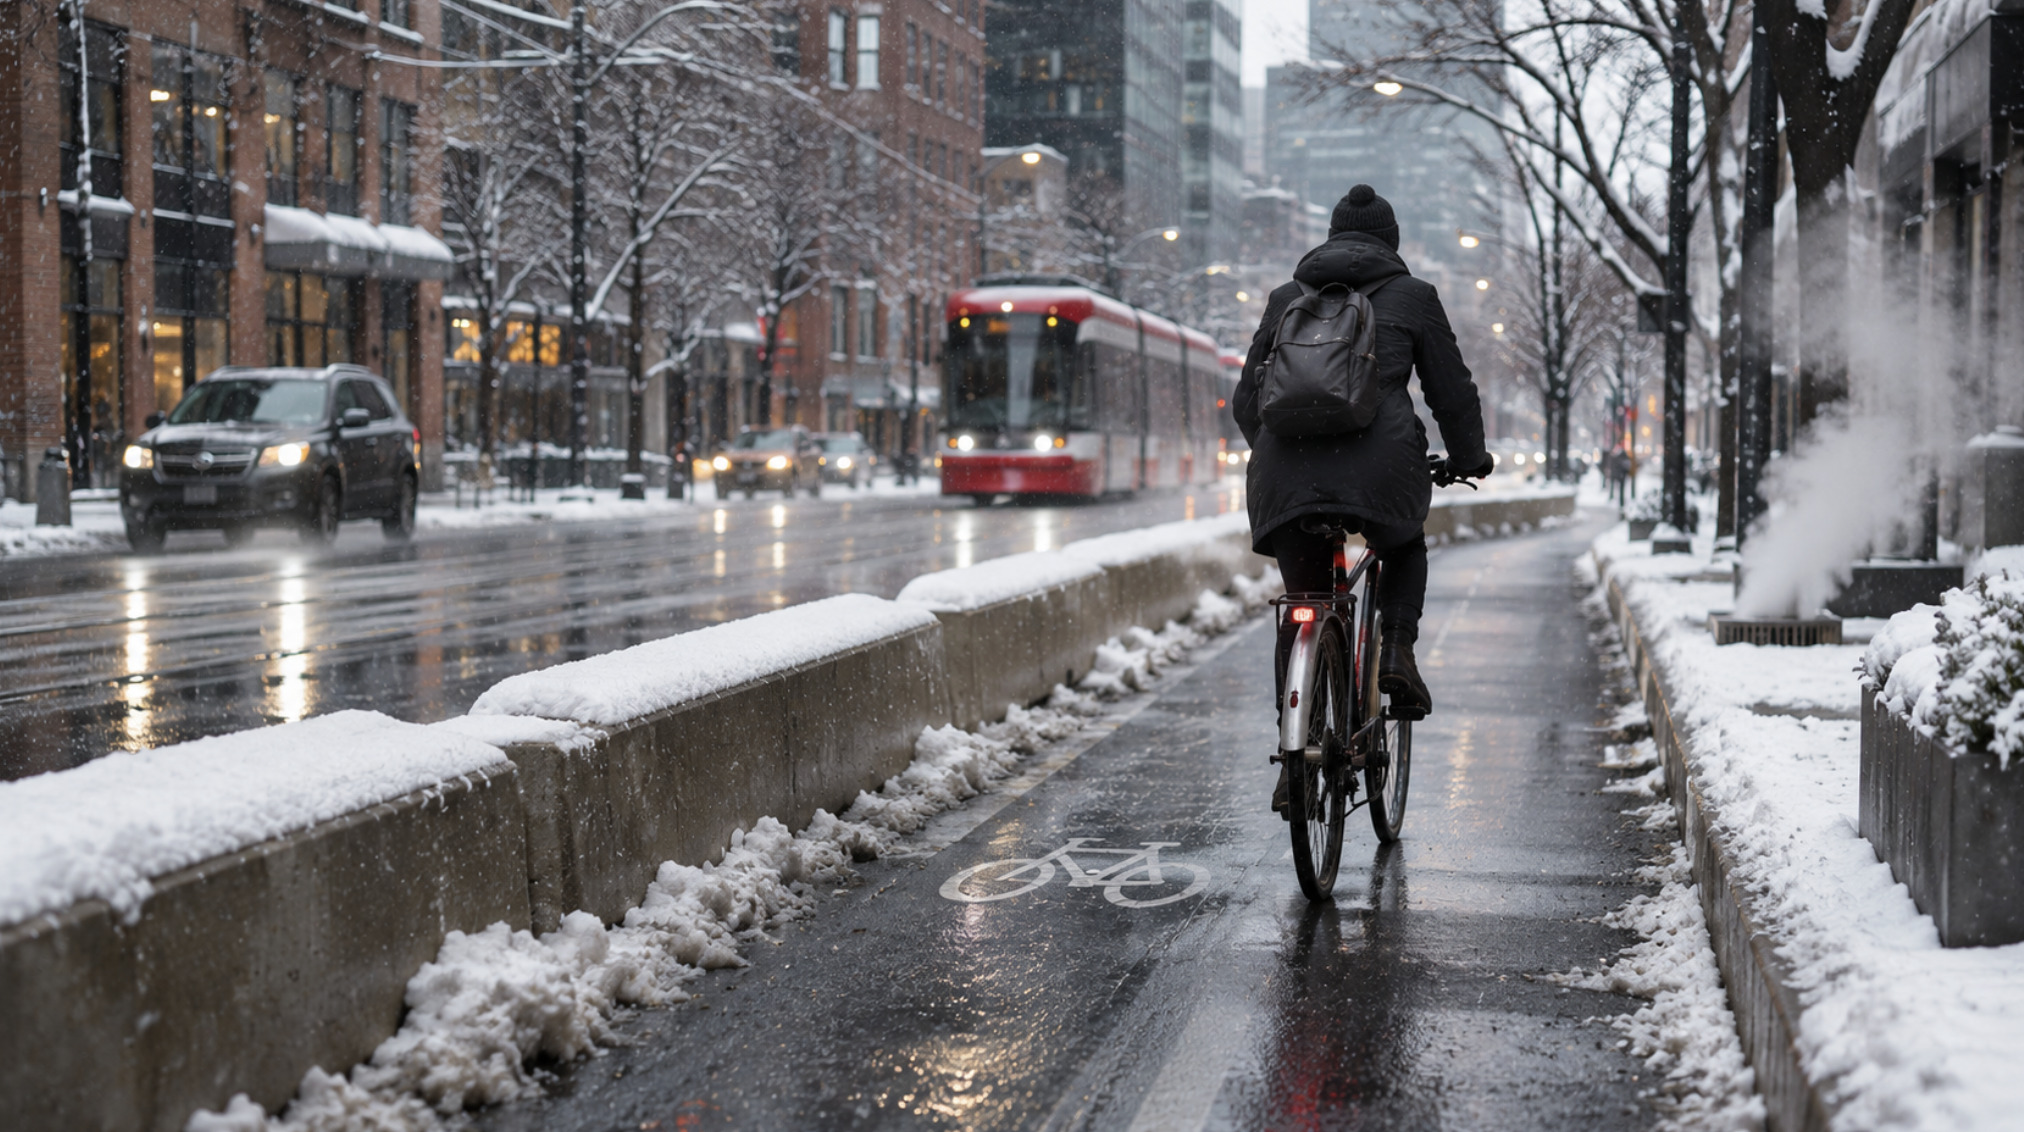
Intersections and transitions. Road plows push snow toward the curb — which is where painted bike lanes are. Sidewalk machines push snow off the sidewalk — sometimes into the edge of a cycle track or across a curb cut. Each crew may meet its own standard while leaving the other's path blocked.
Equipment fit. Separated cycle tracks are too narrow for road plows and are generally cleared with smaller machines; the 2024 staff report notes that contractors clear them as part of sidewalk operations. That ties cycle-track performance to sidewalk contract performance, which has been the most politically contested part of Toronto's winter program in recent years.
Snow storage. In dense streets, snow must go somewhere. Without removal, windrows and banks migrate into bike lanes and parking lanes. Removal — loading and trucking snow away — is slow and expensive; in February 2026 the City reported five snow storage sites and three snow melters in operation.
Parked and stopped vehicles. Plows cannot clear around vehicles parked or stopped in lanes. Toronto moved in late 2025 to strengthen towing on designated snow routes.
Contract design. After the much-criticized response to a February 2025 storm, Mayor Olivia Chow described contracts signed under her predecessor as flawed for excluding snow removal work, and the City reviewed its program. Operational improvements were introduced for 2025–26. Whether they improve cycling outcomes specifically is not something public data yet allows anyone to judge, because the City does not publish segment-level completion times for bikeways.
That last point matters most. A maintenance standard without published performance data is a statement of intent. Riders experience the network as a chain of segments; the City reports compliance, where it reports it at all, as an aggregate.
Part IV — What other northern cities can (and cannot) teach Toronto
Comparisons with other cities are useful only when the differences are stated as clearly as the similarities. Two cities offer the most relevant lessons, for different reasons.
Montréal: a network defined for winter
Montréal is the obvious Canadian comparison. It is colder and snowier than Toronto, has a dense central core, and operates under the same broad constraints of Canadian municipal finance and a provincial government with its own priorities.
The most instructive difference is conceptual. Montréal publishes two networks. Its full cycling network is about 1,083 km; of that, the City states that 740 km is maintained for year-round use — the réseau 4 saisons — including 251 km of physically protected lanes and 489 km of painted lanes. The rest is seasonal, open from April 1 to November 15. The City's map lets riders select the four-season network. The Réseau express vélo (REV), a set of high-capacity protected axes, is designed as the backbone and is intended to be usable twelve months a year. Montréal's stated practice is to clear four-season lanes at the same time as the adjacent street or shortly after.
This matters because it turns an implicit promise into an explicit one. A Montréal rider knows which routes the city commits to keeping open, and the city can be held to that commitment. Toronto has at times designated a downtown "priority network" for enhanced winter maintenance, and today it says it clears all on-street bikeways and major trails. But its current public standards are written by facility type rather than as a published map of routes guaranteed to be open. A smaller promise that is kept, and visible, may be worth more than a larger one that is unevenly met.
The differences cut both ways. Montréal's boroughs run much of their own snow clearing, which creates variation as well as local accountability. Its snow-removal culture — systematic loading and trucking of snow off streets after major falls — is long-established and expensive. Montréal also does not face a provincial law directing the removal of specific bike lanes. Toronto could adopt the published four-season-network model; it could not simply import Montréal's institutions.
Oulu: maintenance as the product
Oulu, in northern Finland, is often called the world's winter cycling capital, and it is the most cited example in winter cycling literature. Its relevance to Toronto is partly a lesson and partly a warning against easy comparison.
Oulu's network is large relative to its population of roughly 200,000 — reported at more than 800 km of segregated routes — and is mostly separated from motor traffic, shared with pedestrians and designed with winter in mind. Accounts by the city's planners and published case studies describe several practices: treating the main cycling routes under a dedicated maintenance contract (a separate contract for about 130 km of key routes was introduced in 2017), triggering plowing at very low snow depths, avoiding salt in favour of grit, prohibiting snow storage at crossings and intersections, and checking service quality through user feedback. Older regional survey data from 2009 put cycling's mode share at about 22 per cent, with winter cycling in the three lowest months at about a third of the three busiest. Those figures are dated and should be read as historical rather than current.
The lessons that travel are about management: a defined priority network, maintenance contracts written specifically for cycling routes, explicit rules about where snow may be stored, and monitoring of outcomes by users. The differences are about climate and form. Oulu's winter is colder, drier and more stable — conditions many riders find easier than Toronto's freeze-thaw slush — and its network was built largely off-street through decades of planning in lower-density districts. Toronto's network is mostly on existing streets, shared with heavy traffic, transit and parking.
A note on Copenhagen
Copenhagen is frequently invoked in Toronto debates, but its winters are mild and less snowy, so its lessons concern network design, intersection treatment and political consistency more than winter operations. It is a weak model for snow clearance and a strong one for what a continuous network looks like.
Part V — The safety question
What Toronto's numbers do and do not show
The City's Vision Zero reporting lists people killed or seriously injured while cycling each year. From 2016 to 2025, fatalities ranged from one to six a year — six in 2024 and two in 2025 — and serious injuries from 20 to 48. The 2025 figures (two fatalities, 32 serious injuries) are provisional; the City notes a lag of up to a year in verifying serious injuries, and a January 2026 budget note gave slightly different provisional figures.
These numbers are tragic in each instance and too small to support confident year-to-year trend claims. More importantly, the City expresses them as rates per 100,000 residents, not per kilometre cycled or per trip. That is a population rate, not a measure of risk to people who ride. If cycling volumes rise — and Bike Share Toronto alone recorded 7.8 million rides in 2025, up from 2.9 million in 2020 — a flat count of injuries may represent falling risk per trip. Conversely, a drop in injuries during a winter in which few people ride says nothing about whether winter riding is safe. Exposure-adjusted risk requires reliable estimates of how much cycling occurs, where and when; Toronto's counter network is growing but is still small and concentrated on dedicated bikeways.
Seasonality complicates matters further. Fewer people ride in winter, so winter collisions are fewer. Whether each winter trip carries higher or lower risk is a different question, and publicly reported Toronto data does not separate it.
What design evidence supports
Research on cycling safety, including Canadian studies, has consistently associated physically separated cycle tracks with lower injury risk than riding in mixed traffic, while finding painted lanes offer smaller or less consistent benefits. The largest share of serious conflicts occurs at intersections: right-turning vehicles crossing a cyclist's path, poor sight lines at corners, and transitions where protected lanes end. Vehicle speed shapes both the likelihood and the severity of injury. Toronto's own recent upgrades — such as the 2025 rebuild of Harbord Street and Hoskin Avenue with poured concrete curbs, raised bike-and-bus platforms, tighter corner radii and bicycle signals — reflect that evidence.
Winter interacts with every one of these factors. A protected lane that is not cleared stops protecting anyone, because riders move into the general lane. Snowbanks at corners reduce sight lines for both drivers and cyclists. A painted lane covered by a windrow effectively does not exist. And network discontinuity is a safety issue as well as a convenience one: the most dangerous points on many trips are where a protected facility ends.
The provincial dimension
This is where Toronto's year-round question meets provincial politics. Bill 212 directed the removal of about 19 km of protected lanes on Bloor Street, Yonge Street and University Avenue. Cycle Toronto and two individual applicants challenged it under section 7 of the Charter, and in July 2025 the Ontario Superior Court found that the removals would violate cyclists' rights to life and security of the person. On August 14, 2026, a unanimous panel of the Court of Appeal for Ontario overturned that decision, holding that decisions about the design of public roads are within the legislature's authority and do not engage the Charter in that way. The province issued a request for proposals on September 1 covering Bloor, Yonge, University, Queen's Park, Queen's Park Crescent and Avenue Road, with some scope to retain or redesign lanes, and work began in October on a section of Bloor Street West in Etobicoke, according to published reports. Cycle Toronto has said it is seeking to take the case to the Supreme Court of Canada.
The court's ruling settled a question of legal authority, not of road safety; the engineering evidence presented at trial has not changed. For a winter network, the practical consequence is that some of the most continuous and most used protected corridors in the city — including the Yonge Street lanes north of Bloor, where the City recorded its highest ratio of winter to summer cycling — are being removed or reconfigured at the same time as the City is trying to improve winter reliability elsewhere.
Part VI — Who can realistically cycle year-round?
Winter cycling advocacy sometimes implies that anyone can ride all year with the right clothes and tires. That is not true, and a serious policy should not pretend otherwise.
Age and ability set real limits. Older adults face greater consequences from falls on ice, and fall-related injury is a major public-health concern in winter cities generally. Children cycling to school need routes that are cleared before school starts, not by the end of an eight-hour operating window. People with mobility, balance or sensory impairments may be able to use adapted cycles, tricycles or e-bikes on good infrastructure in summer but find winter conditions prohibitive. For many disabled residents, the relevant winter network is not bike lanes at all but sidewalks, curb cuts, bus stops and accessible transit — and when snow is pushed from a cleared bike lane onto a sidewalk or a bus pad, one group's access is improved at another's expense.
Occupation and schedule matter as much as fitness. Shift workers travel when maintenance crews may not yet have reached their route, and when daylight and transit service are at their weakest. Delivery workers — many of them on e-bikes, many newcomers to Canada — ride all winter because their income depends on it, often on whatever surface is available; their experience during the January 2026 storm featured prominently in media coverage. For them, winter maintenance is a workplace safety issue, not a lifestyle choice.
Distance and geography shape possibility. A downtown resident with a three-kilometre commute on a protected route is in a different position from someone in northern Scarborough with a fifteen-kilometre trip across arterials. Expanding the network into the inner suburbs, where incomes are often lower and transit connections longer, has potential equity benefits — the City's own framing of the Cycling Network Plan emphasizes reducing inequities in spatial access — but only if those routes are maintained to the same standard as downtown corridors. A suburban cycle track cleared last is a fair-weather facility.
Income cuts in several directions. Cycling is cheap relative to car ownership, which makes it valuable to lower-income households. But winter-capable equipment, secure storage, and the time cost of a slower winter commute are not trivial, and households without a car are the most exposed when both sidewalks and transit are degraded by snow.
The implication is not that winter cycling infrastructure is unimportant. It is that its benefits are concentrated among people who can and do ride — and that its legitimacy depends on being maintained as part of a system that also keeps sidewalks, transit stops and roads usable. A city that clears bike lanes beautifully while bus stops remain buried has not built a year-round transport network; it has shifted the problem.
Part VII — The economics of a year-round network
Toronto's public budget documents allow a few firm statements and many cautions.
On the capital side, the City reports spending $192.5 million on bikeway implementation between 2019 and 2025, with annual actuals rising from $14.4 million in 2019 to a peak of $45.2 million in 2024 and $35 million in 2025; $35 million is approved for 2026. A 2024 staff estimate put the cost of the 2025–2027 near-term program at about $35 million a year. On the operating side, the City's winter maintenance budget for 2025 was reported at more than $160 million, covering roads, sidewalks and bike lanes together. The City does not publish a separate figure for what winter cycling maintenance costs, which makes claims that it is either trivially cheap or prohibitively expensive impossible to verify from public data.
The provincial removals add a cost of a different kind. A City staff report in November 2024 estimated the direct cost of removing the Bloor, Yonge and University lanes at a minimum of $48 million, on top of the roughly $27 million spent installing them. Those figures were produced before the province's 2026 procurement, and the final cost will depend on what the selected design actually does.
What would a reliable winter network cost? The honest answer is that it depends on choices the City has not fully specified. Clearing a separated cycle track requires small-format equipment, operators available at short notice, and — on dense streets — snow removal capacity so that banks do not migrate back into lanes. Those costs scale with the length of the guaranteed network, the trigger depth, the response time and the share of the network that needs snow hauled away rather than pushed aside. A city that commits to a defined priority network can cost that commitment precisely. One that promises to clear everything to a uniform standard will find the real cost revealed storm by storm.
Benefits are harder to quantify honestly. Plausible ones include fewer serious injuries where protected lanes remain usable, more reliable travel times for people who depend on cycling, health benefits from physical activity, and reduced pressure on crowded transit routes at peak times. Each is real in principle; none can be assigned a reliable dollar value for Toronto's winter network from published data, and this article will not invent one.
Comparisons across modes need particular care. Claims that a bike lane "causes congestion" or "relieves congestion" depend on assumptions about how many trips shift between modes, on which streets, and over what timescale. The provincial government has argued that restoring vehicle lanes will reduce gridlock; evidence filed by the applicants in the Charter case argued it would not. Any credible comparison would need to count all users of a street — people driving, riding transit, cycling and walking — through the same seasons, using the same methods. Toronto's growing open data, including multimodal intersection counts and permanent bicycle counters, makes that kind of analysis increasingly possible. It has not yet been published for winter conditions specifically.
Part VIII — A realistic roadmap for Toronto
Nothing below requires Toronto to become Oulu or to pretend winter does not exist. It requires treating winter reliability as a measurable property of the network rather than a by-product of road clearing. The steps build on each other.
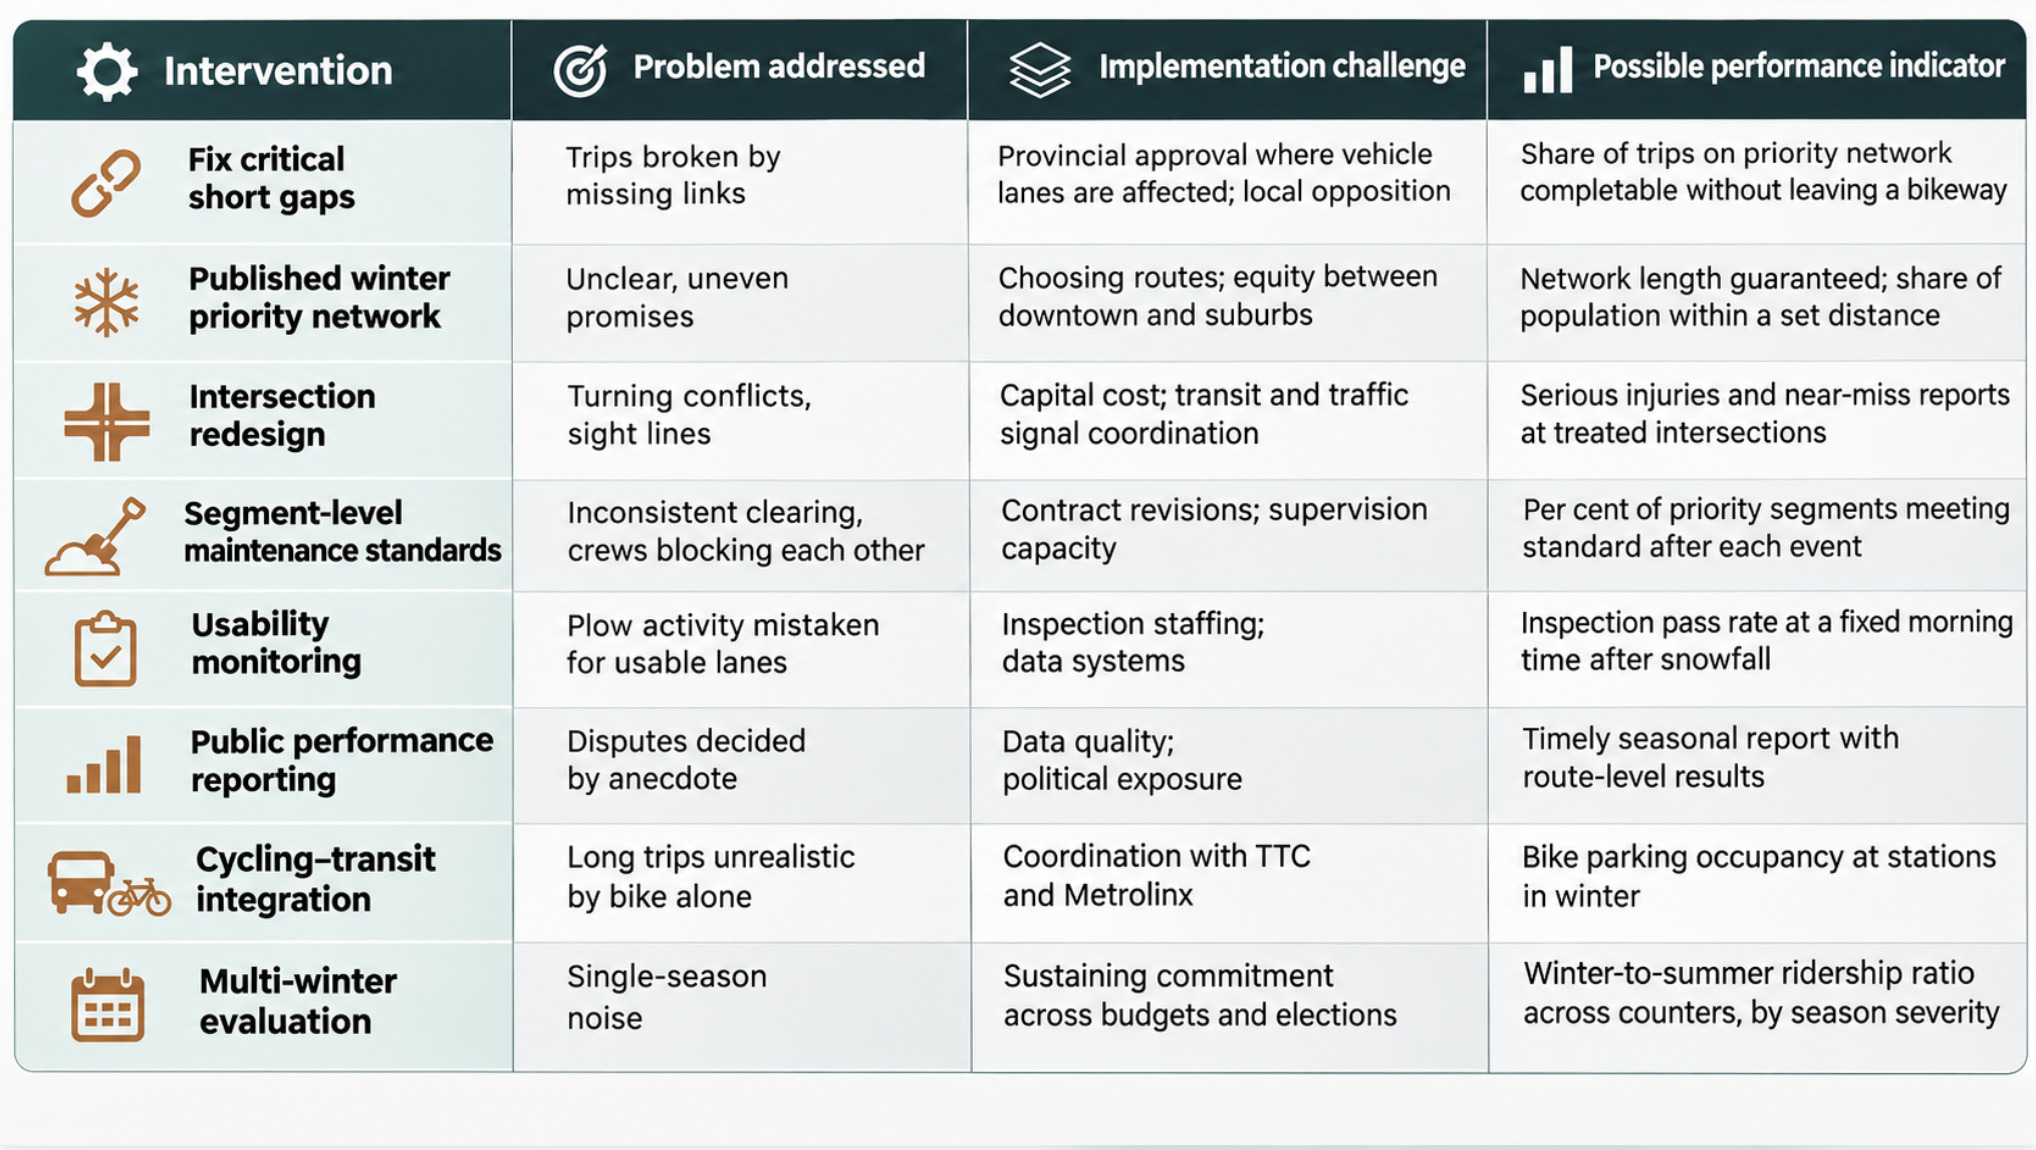
Identify the gaps that break trips. The City already has the analytical tools — its Cycling Network Plan prioritization framework and open count data. The task is to apply them to winter: which short missing links, unsafe intersections and transitions force riders into traffic or off their bikes? Fixing a 200-metre gap can do more for usability than adding two kilometres elsewhere.
Prioritize a connected winter network and publish it. Following Montréal's example, designate the routes the City guarantees to keep open, show them on a public map, and make the standard for those routes higher and more specific than for the rest. Under current provincial rules, routes that require removing a vehicle lane face approval hurdles, so the winter network will need to draw heavily on existing facilities, multi-use trails, boulevard cycle tracks and quieter parallel streets.
Fix intersections first. Corners are where conflicts concentrate and where snow from multiple crews collects. Design measures such as protected corners and bicycle signals help in every season; in winter they must be paired with rules that snow is not stored at crossings or curb cuts — a practice Oulu's planners describe as basic.
Make maintenance standards measurable at the segment level. "Within eight hours of 2 cm" is a good standard. It becomes a reliable one when each priority segment's completion time is recorded and audited, and when cycle-track, sidewalk and road crews are contractually responsible for not blocking each other.
Monitor usability, not just activity. Plow GPS logs show where equipment went. They do not show whether the lane was rideable at 7 a.m. Spot inspections, user reports through 311 tied to specific segments, and counter data compared against snowfall would show whether the network actually works.
Publish the results. A seasonal winter-cycling report — completion times by route, complaints, counts against weather — would let residents and councillors judge performance on evidence rather than social-media photographs.
Plan cycling and transit together. Secure bike parking at subway and GO stations, cleared routes to them, and bus stops that are not buried by bike-lane clearing make a combined trip viable in winter for people whose whole journey is too long to ride.
Evaluate over several winters. One winter is weather; several are evidence. Mild and severe seasons will produce very different results, and policy should be judged on the pattern.
A cycling city is built for the worst ordinary day
Return to the commute after the overnight snow. The weather was unremarkable. The cycle track was clear. The trip failed at a connector street, a corner and a buried curb cut — all of them matters of design, coordination and maintenance rather than climate.
That is the most defensible answer to the question this article began with. Winter makes cycling in Toronto harder, and on some days it makes it unwise. But the gap between the city's winter riding and what it could be is largely infrastructural and institutional: discontinuous routes, intersections where snow collects, standards that are not measured segment by segment, and — now — a provincial government removing protected corridors that carry some of the city's strongest winter ridership.
None of this makes cycling a substitute for transit, walking or, for many trips, driving. A realistic policy treats it as one part of a multimodal system, keeps sidewalks and bus stops clear alongside bike lanes, accepts that many people will not ride in January, and spends money where a defined network can be guaranteed rather than promised everywhere and delivered somewhere.
Transport reliability is never judged by the best day of the year. It is judged by the ordinary bad ones: the eight-centimetre snowfall, the overnight freeze, the slush at the corner. Toronto can become a city where a bicycle is a dependable way to get around on those days for the people who choose it. Whether it does will depend less on the weather than on whether the city decides, publicly and measurably, which routes it will keep open — and then keeps them open.

Noah Bennett
Cycling Industry & Tech Writer
Noah is passionate about the mechanics behind movement — from bike engineering to emerging mobility technologies. He covers innovations in cycling equipment, e-bikes, and urban transport solutions, combining technical understanding with real-world usability. His articles explore how technology is reshaping everyday transportation and redefining the future of city commuting.
Advertise With Toronto Union 24
Reach over 500,000 engaged Canadian readers monthly. Premium placements available for Q2 2026.
Learn More Daniel Hughes